Intelligent Cloud Insights
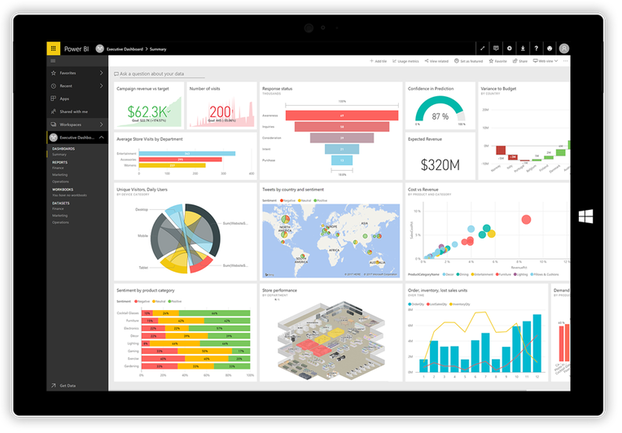
Microsoft Power BI is a powerful cloud-based business analytics service which interfaces with your on-premise or on-cloud ERP to unlock insights and drive more informed decisions for your company. Through the use of live dashboards and interactive reports, Power BI gives you the ability to view your most crucial business data instantly and monitor the progress of your sales, inventory or employees on the go.
Microsoft Power BI is a powerful cloud-based business analytics service which interfaces with your ERP and The RIC Group's WMS to unlock insights and drive more informed decisions for your company. Through the use of live dashboards and interactive reports, Power BI gives you the ability to view your most crucial business data instantly and monitor the progress of your sales, inventory or employees on the go.
Microsoft Power BI is a powerful cloud-based business analytics service which interfaces with your ERP and The RIC Group's WMS to unlock insights and drive more informed decisions for your company. Through the use of live dashboards and interactive reports, Power BI gives you the ability to view your most crucial business data instantly and monitor the progress of your sales, inventory or employees on the go.
Any of the analytical graphs and charts from Microsoft Power BI can be shared within your company to ensure that everyone (with the right access level) can see the same data and are on the same page. The RIC Group has had experience in interfacing Microsoft Power BI with our Warehouse Management Solution and have build preset templates for ERPs such as SAP Business One, Acumatica, MYOB Advanced, MYOB EXO and Sage 300.
REAL-TIME DASHBOARDYour real-time dashboard gives you the ability to find all the important data at one glance and instantly know when your business requires your attention. This allows you to solve problems as they occur and seize opportunities as they arise. The dashboard is easily accessible from your phone or tablet through the Microsoft Power BI App or through web browser, allowing you to monitor the performance of your business remotely.
|
ASK QUESTIONSYou will love the "Native Language Query" feature which provides an impressive way of getting the right interactive visualization to answer your queries by simply asking questions and queries about your data in a natural way such as "Sales this month by customer" to display the sales amounts generated during this month grouped by customer. Microsoft Power BI is smartly designed to interpret your questions and display the information required in the best possible way.
|


