Why forecasting keeps getting skipped
Most warehouses do not run out of stock because nobody cared. They run out because the reorder decision lives in a spreadsheet someone updates when they have time, using last month's export and a lead time someone remembered.
The cost shows up in two places. Fast movers run dry while a container is still on the water, and slow movers tie up cash and bin space for months. Both are forecasting problems, and both are visible in data your WMS captures every day.
The signal is picks versus receipts
Every pick is a unit of real demand leaving the building. Every receipt is a unit of supply coming in. Put the two side by side by item and by month, and you can see which items are being drained faster than they are being refilled.
Add two more facts and you have a reorder decision:
- Stock on hand from the bins, including what is sitting in receiving.
- Lead time from the supplier, which in Australia commonly runs from 2 weeks for a local distributor to 16 weeks for a sea freight import.
A WMS like TBO4 already holds the first three. Lead time usually lives in the ERP or the supplier record, and that is the one number most worth cleaning up.
Start with the WMS, then grow into forecasting
Most businesses implement TBO4 to get receiving, picking and dispatch under control. That is the foundation, and it is where the clean data comes from.
Once TBO4 is running, the TBO4 MCP Server makes it more powerful. It connects your warehouse data to an AI assistant such as Claude or Microsoft Copilot, which can then do the work of tools that are usually bought separately and bolted onto the ERP. Demand forecasting is a good example. Instead of paying for another forecasting module and feeding it exports, you ask the assistant to look at what has been picked, what has been received and what is in stock, and it builds the forecast for you.
The data is live, so Monday's answer uses Monday's stock, not last Friday's spreadsheet. The same assistant can turn the result into an order list for the buyer or a dashboard the team checks every week.
What it looks like: a sample forecast dashboard
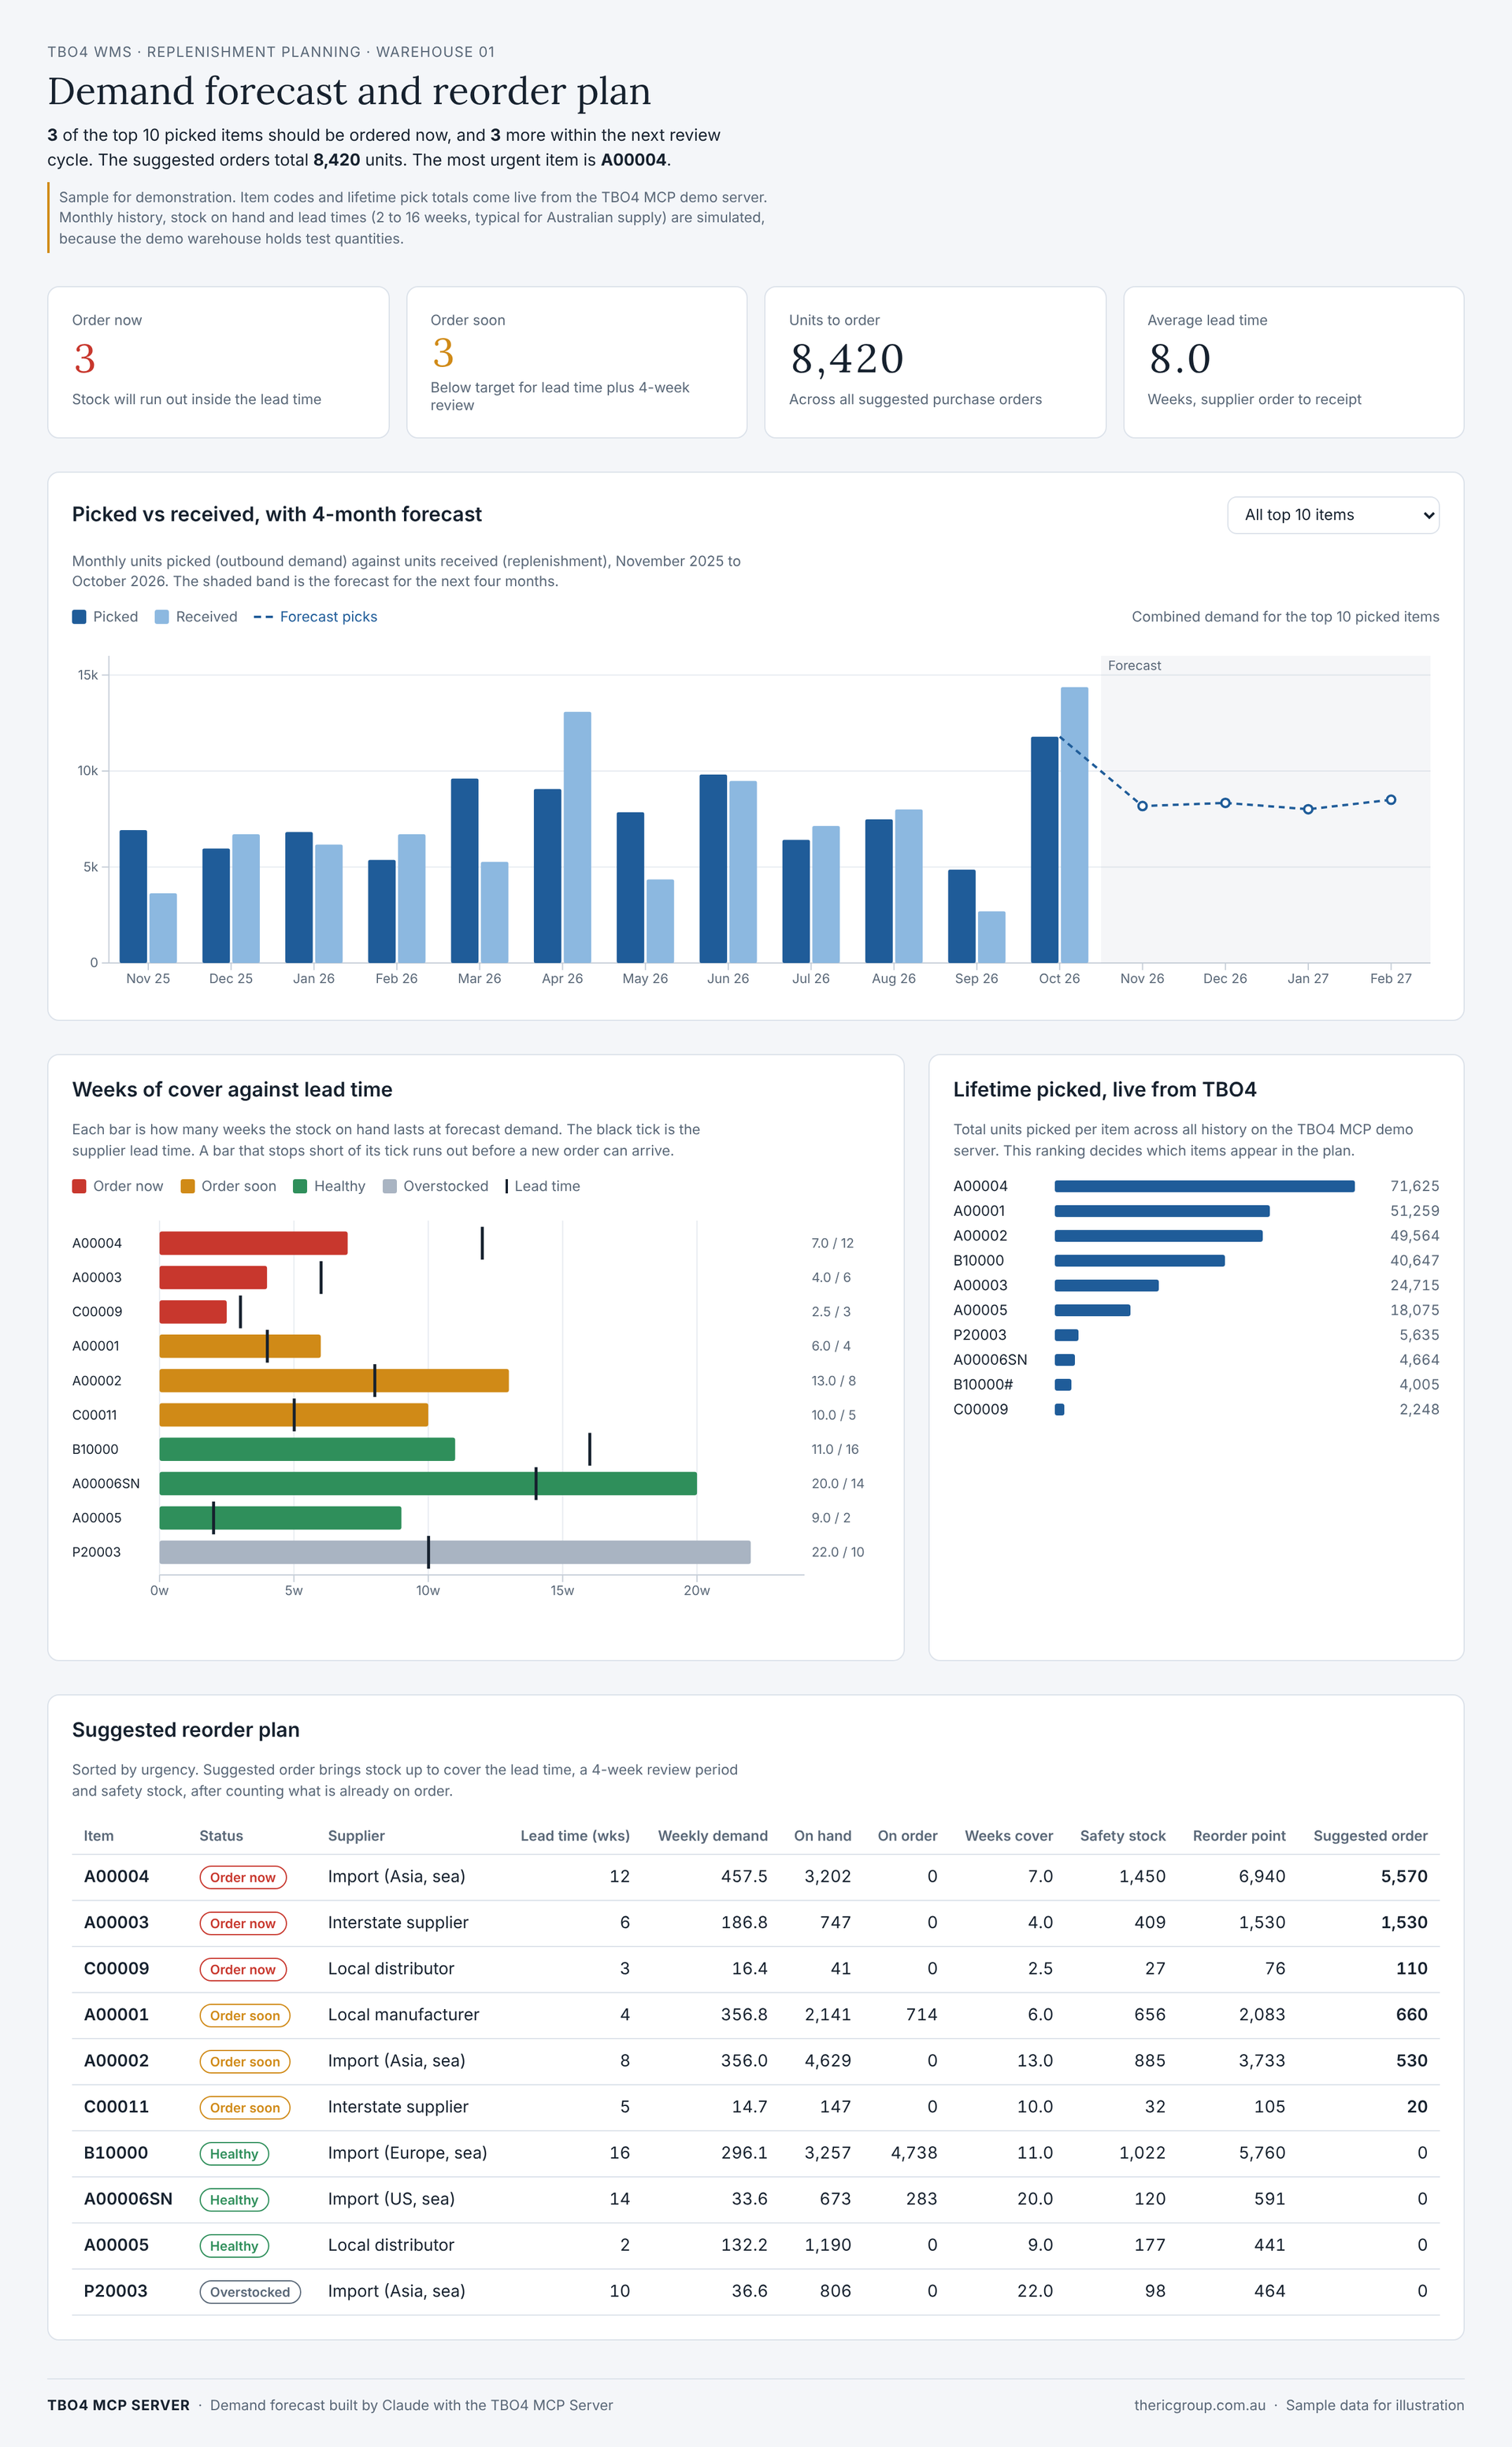
We asked Claude to build a demand forecast from the TBO4 MCP demo server. It ranked the top 10 items by units picked, then laid out three views a buyer can act on. The item codes and pick ranking are live demo data; the monthly history, stock and lead times are simulated for illustration.
Picked vs received. Twelve months of picks and receipts side by side, with a dashed four-month forecast. When the picked bars keep outgrowing the received bars, stock is draining.
Weeks of cover against lead time. This is the chart that decides the order. Each bar shows how many weeks current stock lasts at forecast demand, and a tick marks the supplier lead time. In the sample, A00004 has 7 weeks of cover against a 12-week import lead time, so it will run dry roughly five weeks before a new container can land.
The reorder plan. A table sorted by urgency, with weekly demand, on hand, on order, safety stock, reorder point and a suggested order quantity. In the sample, three items are flagged to order now, three to order soon, and the suggested orders total 8,420 units.
The maths, kept simple
You do not need a data science team for a sound first forecast. Four calculations do most of the work.
- Weekly demand. A weighted average of the last six months of picks, with recent months counting more.
- Safety stock. A buffer for demand swings during the lead time. At about a 95% service level it is roughly 1.65 × weekly variability × √lead time in weeks.
- Reorder point. Weekly demand × lead time + safety stock. When stock on hand plus stock on order drops below it, order now.
- Order quantity. Enough to cover the lead time, the time until the next review and safety stock, minus what you already hold and have on order.
The long lead times are where this pays off. A local item with a 2-week lead time forgives a late decision; a 16-week import does not.
Getting started
The TBO4 MCP Server keeps getting smarter, and forecasting is a natural next step for customers already using it to query and run their warehouse. To get a useful forecast running on your own data:
- Check your history. Twelve months of pick and receipt data per item gives a usable trend; more is better.
- Fix lead times first. Put a realistic lead time against each supplier or item. It moves the result more than any formula.
- Start with your fast movers. Plan the top 10 to 20 picked items before tackling the long tail.
- Make it a habit. Re-run the forecast at each buying cycle, in Claude or Copilot, and share it with the team in Teams.
Most MCP servers tell you what is happening in your warehouse. The TBO4 MCP Server lets you change it, and that starts with ordering the right stock before you need it.
To see a forecast built on your own TBO4 data, contact The RIC Group at
thericgroup.com.au or watch
TBO4 MCP Server for Operations on YouTube.