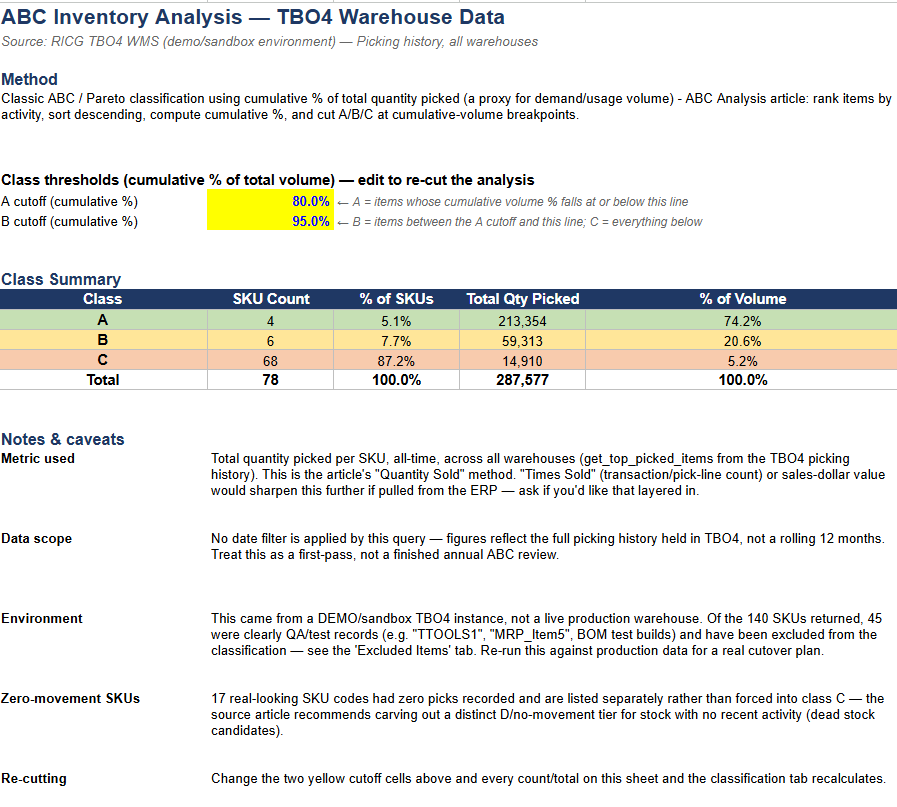
Want to know if the TBO4 MCP Server is useful? Take a look at the image above and not the ABC Inventory analysis was given to Claude AI to run and it came back with the above results.
Most warehouses still treat every SKU the same way: same cycle count frequency, same slotting priority, same level of attention from the ops team. But anyone who has looked closely at their pick data already knows that's not how the warehouse actually behaves. A small slice of your catalogue drives the overwhelming majority of your outbound activity, and the rest is a long tail of items that barely move.
That's the idea behind ABC analysis — one of the oldest and still most useful tools in inventory management. It's a well-worn theory. The harder question has always been what it takes to actually run it against your own warehouse, rather than just knowing it exists. We put that to the test using TBO4's MCP server and the activity data TBO4 already captures, and the exercise says as much about closing that gap as it does about the method itself.
The theory: ABC analysis
ABC analysis applies the Pareto principle to inventory: a small number of items account for a disproportionate share of your sales, transactions, or warehouse activity. You rank your SKUs by whatever measure matters most to your business, then group them into tiers:
- A items — your highest-impact SKUs, usually a small fraction of your catalogue
- B items — a moderate tier, still worth managing closely
- C items — everything else, high in count but low in individual impact
The classic reference on the topic (from inventoryops.com) points out that businesses tend to measure this a handful of ways — transaction frequency, quantity sold, inventory investment, sales dollars, or gross margin — and that frequency of sale is often the most operationally useful, even though sales dollars or margin will tell you more about where your profit actually comes from. It also makes a point worth repeating: don't get married to the textbook 80/20 split. The real breakpoints should fit your business, and it's often worth adding a D or E tier for stock that isn't moving at all.
None of this is new. It's been standard inventory theory for decades. What's usually missing isn't the concept — it's a fast, reliable way to point it at real data.
Turning theory into a live query
That's exactly where the MCP server changes the equation. TBO4 already captures every pick, receipt, transfer and adjustment as structured data. The MCP server exposes that captured activity so it can be queried directly and on demand — no export, no waiting on a BI request, no rebuilding the same spreadsheet next quarter.
We used it to run the ABC theory for real: pulled total quantity picked per SKU straight out of TBO4's activity data, ranked every item from highest to lowest, and calculated a running cumulative percentage of total volume to find the natural breakpoints — the exact mechanics the theory calls for, done against live captured data instead of a manual export.
On this run, the split looked like this:
- Class A — 4 SKUs (about 5% of the catalogue) accounted for 74% of total volume picked
- Class B — 6 SKUs (roughly 8% of the catalogue) added another 21%
- Class C — the remaining 87% of SKUs made up just 5% of volume
That's about as clean a Pareto curve as you'll see in a real operation, and it's a pattern that holds up again and again once you actually look. It's also exactly why treating every SKU identically wastes effort: your A items deserve prime bin locations, tighter cycle count schedules and priority replenishment, while your C tail often just needs to stay out of the way.
We also set aside a handful of records with zero recorded pick activity rather than lump them into Class C — genuine non-movers are a different problem (dead stock, discontinued lines, data cleanup) and deserve their own conversation rather than getting buried at the bottom of an ABC table.
Theory alone doesn't move a warehouse — insight does
This is really the difference the MCP server makes. ABC analysis has been sitting in inventory textbooks for years; almost every warehouse manager has heard of it, and most know roughly why it matters. What's historically stopped it from being used more often is the gap between "we know the theory" and "we have the numbers, today, from what actually happened in our warehouse this month."
Because TBO4 is already capturing that activity as it happens, and the MCP server makes it queryable directly, that gap closes. You're not asking someone to build a report — you're asking the question and getting an answer built from what's actually in the system right now. The theory hasn't changed. What's changed is how quickly it turns into something you can act on.
Where to take it from here
ABC analysis is a starting point, not an end state. Once you know which SKUs are doing the heavy lifting, the natural next steps are re-slotting your A items closer to pack-out, tightening cycle counts on your highest-value tier, and setting replenishment rules that match how each class actually behaves — rather than applying one policy across the whole catalogue.
If you're curious what this looks like against your own warehouse data, we'd be glad to walk through it — reach out to the
The RIC Group team and we'll show you how quickly the theory turns into insight.